Featured Article
Latest Post

Rabu, 08 Februari 2012

Trading With Stochastic Oscillator

So far we have a lot to discuss about forex that can allow you to read forex charts and predict the price direction.

This time we are still going to discuss about indicators of technical analysis. If yesterday we talked about the trend indicator, so now we switch to oscillator indicators, used to determine areas of overbought and oversold.

And the first oscillator indicators to be discussed is the Stochastic Oscillator.

Stochastic Oscillator is an indicator that helps us to determine when trend might be end up. By definition, a Stochastic is an oscillator that measures overbought and oversold conditions in the market. Stochastoic Oscillator consists of two lines called %K and %D. %K is himself and the %D is the SMA of %K. It could be said that the %D is a line identifying the direction of %K.

This is the appearance of the stochastic oscillator.

Trading With Stochastic Oscillator
Img 1 by. Erdy Wijaya (click image for larger view)
Now we begin to hunt the treasure. Stochastic Oscillator gives us the location where the treasure is located. we can see the line up and down like a roller coaster at the amusement park. But these lines gives us a clue about the treasure that are stored in the forex world.

Take a look at the picture below.
Trading With Stochastic Oscillator
Img 2 by. Erdy Wijaya (click image for larger view)
Can you see the location of the treasure? I can see with the naked eye. Here's the explanation, the stochastic oscillator will give you information about the "state of the market that had" oversold or overbought. If stochastic is in area 80 (top) (%K and %D cross each other), then most likely the reversal will occur toward the bottom, it is the right moment to sell. And when the Stochastic Oscillator is in area 20 (bottom) (%K and %D cross each other), then most likely the reversal will occur toward the top, it is the right moment to buy. It's all in your hands, do you want to use that information or not? Take advantage, then you'll be a happy person.

Each trader has their own settings in using Stochastic Oscillator. And this is my settings, you can use it. But better if you create your own settings.


Do the steps on the image 1, then see the picture below.
Trading With Stochastic Oscillator
Img 3 by. Erdy Wijaya (click image for larger view)
After that, I began to search for treasure. This is what I do when the two lines pass through each other.
Trading With Stochastic Oscillator
Img 4 by. Erdy Wijaya (click image for larger view)
I really get the treasure, hehehehe. You can even try it. But you should try it first on a demo account until you really know this indicator. Like the other indicators, the stochastic oscillator also has a false signal. So be careful.

Rabu, 01 Februari 2012

Trading With Parabolic SAR

We return to discuss the trend indicator is used to determine the ongoing trend or predict future trends. Parabolic SAR is an indicator that will be discussed this time.

In 1978, J Welles Wilder introduced the Parabolic SAR. SAR stands for Stop and Reverse. In essence, this indicator can be used to determine the point of Stop Loss in trading. During its development, Parabolic SAR is one of the indicator to determining trends effectively.

Correct,, with Parabolic SAR, we can find the ongoing trend and when the trend ends. We can know when to enter the market and when to exit the market. Truly effective. the way you get the Parabolic SAR can be seen in the image below.
Trading With Parabolic SAR
Image 1 (by. Weihome Team)
Yellow dot lined up is called the Parabolic SAR. Like the troops are marching, right? ...

How to use the Parabolic SAR is quite simple. We can see the ongoing trend easily. see, Parabolic SAR will be under the candlestick when the uptrend is going on. And the Parabolic SAR will be above the candlestick if downtrend is going on. Reading forex chart is very easy, right?
Trading With Parabolic SAR
Image 2 (by. Weihome Team)
Look at the picture above. What does that mean, buddy? The meaning is, buy when Parabolic SAR is under the candlestick and sell at Parabolic SAR is above the candlestick. It's amazing, Parabolic SAR tells us where the treasure is located.

You already know when to enter the market, but you also need to know when you exit the market. With Parabolic SAR, you can know it. It's easy, exit when 3 Parabolic SAR dots appear and fight the trend. More details look at the picture below.
Trading With Parabolic SAR
Image 3 (by. Weihome Team)
If you can take advantage of this situation well, you can reap a huge profit.

But, as we have discussed before, the risk will always exist. No system is perfect and constantly give us profit. Sometimes any sophisticated indicators will give us false signals.
Trading With Parabolic SAR
Image 4 (by. Weihome Team)
False signals will always appear in your trading life. So you have to keep practicing in order to know when the false signals appeared. some points that might help you if you use the Parabolic SAR.

• Avoid during sideways market.
• Do not rush to order just because you see the Parabolic SAR to move toward
• Required further confirmation, such as waiting after the end of a retracement.
• Combining with the stochastic indicator type.

Henceforth, we will still discuss about indicators, until finally you can combine several indicators that match your personality. Keep stay tune guys ...

Selasa, 31 Januari 2012

Trading With Moving Average

Moving Average (MA) is a trend indicator that is used to determine the trend is going at the time. Based on data from the candlestick in the past, we can predict future prices by looking at MA indicators. How I get the MA indicator? Relax, I'll show you how the way. Let open your trading terminal!
Trading With Moving Average
Img 1 (by. Weihome Team)
White line passing between the candlestick is a moving average. MA have some type. But here, I will only describe two types of MA. Because we will only use one type of MA only. We make this into a simple lesson. Sometimes, simple is better.

OK, there are two types of MA which will be discussed here.
• Simple Moving Average (SMA)
• Exponential Moving Average (EMA)

SMA (simple moving average) is "the simplest MA" and does not use weighting in the calculation of the closing price. EMA (exponential moving average) is a refinement of the method of SMA. Why is perfected? because the SMA very late in delivering the signal, then the EMA was born to provide early signals. The drawback, if you use the SMA, usually will be late to entry because the signal is given too late. But if you are using the EMA, usually you will often get stuck in false signals, because EMA provides an early signal. Well .. well .. in this world nothing is perfect. So, which one is best to use? Depending on your character. If you prefer to secure thing, use the SMA is a good choice. However, if you prefer to a risky thing, it looks like the EMA would be a good friend for your adventure.

Where can I find SMA or EMA? Easy, follow the first step in the image above, then see the second step in the image below.
Img 2 (by. Weihome Team)
Have you choose the type of MA that you will use? Keep in mind again, SMA provides a lately signal and just grabbing a few pips, but will rarely give false signals. Like driving a car with a speed of 40 km / hour. Different from the EMA that provide early signals and can earn more pips, but you could potentially get more false signals. Like driving a car with a speed of 120 km / hour. If you drive a car 40 km / h, will be long reaching your destination, but safe. Meanwhile, you'll save time by driving 120 km / hour, but you are probably going to hit other cars, pedestrians, or a grandmother who was crossing in the crosswalk. So, which one would you choose. My advice, consider with your psychology.

Now we begin to use the MA in your trading. For example, I will use 2 EMA with period 10 and 20. EMA 10 is yellow and EMA 20 is white. Here's how to put it in our candlestick charts. First, follow the steps on image 1, then watch the image below.

Trading With Moving Average
Img 3 (by. Weihome Team)
The picture above is how to enter EMA 10 into your forex charts. Do the same thing to enter the EMA 20, but replaced the period = 20, and Style = white.

EMA 10 means that the data given by the average of 10 last candlestick. And EMA 20 means that the data given by the average of 20 last candlestick.

Now you have two EMA on the your candlestick chart. Now we begin to find the location of treasure. The Techniques to be used is the trend and the crossing. With EMA, you can easily find the ongoing trend. Pay attention! If EMA 10 is above the EMA 20, it means that the uptrend is going on. And if the EMA 10 is below EMA 20, it means that the downtrend is underway.

In addition, EMA could provide clues when we entered the market. That is the technique of moving average crossovers. Where between EMA 10 and EMA 20 meet and then pass each other. look picture below ...
Trading With Moving Average
Img 4 (by. Weihome Team)
Look! The location of the treasure is so clearly visible. Sell when EMA 10 across EMA 20 downward, and Buy at EMA 10 across EMA 20 upward. Yes ... yes ... yes ... I'll be rich as soon as possible. Hey, wait ... don't forget that the risk is always there. As in other techniques, EMA has its drawbacks as well. if other techniques always give false signals, EMA will also give you false signals. Because forex is not an exact science. Once again, forex is not an exact science.
Trading With Moving Average
Img 5 (by. Weihome Team)
The picture above explains that all the techniques in the world is not 100 percent profit. The way to avoid false signals are:

• experience
• Exercise on a demo and learn it.
• Combining with other indicators.

In the next article, we will discuss about the indicators that you'll use, at last you can combine with other indicators and create a system that can gives profits consistently. Do you want to? Keep stay tune guys ...

Minggu, 29 Januari 2012

Preparation of Technical Analysis

You already knew that a lot of treasures that are stored on your forex charts. And you need a map to get it. But you have to remember, besides there are many hidden treasures, forex has pitfalls that can make lose your money. if you potentially get a greater treasure, then the losses would be greater too. Do not forget that.

In this season, we will discuss about technical analysis. Yes, the technical analysis can be a map for you to get a hidden treasure. Technical analysis is a framework where the trader is studying price movements. The theory is that someone can look at historical price movements and determining the current trading conditions and the potential price movement in the future.

In technical analysis, we will need some indicators. Indicator is a device that is used to predict the trend of price movements, oversold & overbought, or support & resistance. The device is based on historical data in the past. The point, the indicators will be our treasure map for technical analysis.

Indicator created by technical analysts. There are many indicators out there. But we will only use 3 to 4 indicators. Believe me, using too many indicators will make you more confused. Too many different maps will only make you lost.

If you already joined Instaforex, please open the MT4 terminal. Let me show you the location of the indicators you will use. If you do not have, you can click the banner below and register, then download and install the terminal. Relax, free register.
<a href="http://instaforex.com/?x=DDJO">InstaForex</a>

And now, please open your terminal...

Preparation of Technical Analysis

The picture above is my terminal. I'm using a forex chart, candlestick chart. My arrows shows the place where you can find the indicator you are looking for. you can see there are five indicator groups, each group has a indicator with each function. As the trend, the indicators included in the category trend is useful to look at the ongoing trend at the time, or predict future trends. Meanwhile, the Oscillator to determine overbought and oversold areas.

Ok, that all for this time. In the next article, I will describe some of the indicators will you use as your treasure map. So, keep stay tune guys ...

Sabtu, 28 Januari 2012

Candlestick Pattern 2

Now we go to episode 2. Yes, we still talk about candlestick patterns that would be a pointer where the treasure is located. Of course, with noticing to the patterns that formed earlier.

Double Candlestick Pattern

Candlestick Pattern
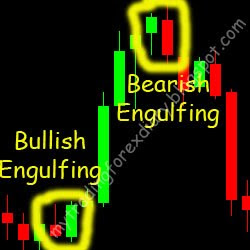
Bullish Engulfing is a reversal from a downtrend to an uptrend. Bullish Engulfing has two candlesticks, where a bearish candlestick followed by bullish candlestick which length is greater than the bearish candlestick. That means, the buyer had eaten the seller and usually there will be a big movement after a downtrend or a period of consolidation.

Bearish Engulfing is a reversal from an uptrend to a downtrend. Bearish Engulfing has two candlesticks, where the bullish candlestick followed by bearish candlestick which length is greater than the bullish candlestick. That means, the seller had eaten the buyer and usually there will be a big bearish movement.

Try to see the picture above. Incidentally, I found two engulfing in my MT4 terminal, occurred on EUR / USD with Time Frame H1. Well ... well ... he's really shows the location of the treasure.

Candlestick Pattern
Tweezer is a two candle reversal. This type of candle pattern can usually be seen after an extended trend, indicating that a reversal is about to occur. See, they look like twins.

Tweezer the most effective must have some provision. Tweezer Bottom, the first candle should be bearish and is followed by bullish candle which is the same shape and size. And tweezer tops, the first candle should be bullish and followed by bearish candle which is the same size.

Triple Candlestick Pattern

Candlestick Pattern
Evening star and morning star are three candle that can be found at the end of a trend. They show the location of the treasure trove of perfectly. But so you do not fall into a false signal, you must know the specifications of the evening star and morning star. such as:

Candlestick Pattern
The first candle are bullish / bearish (depending on the trend that is happening).

The second candle shows that there may be some confusion in the market. Thus, the shape will be small. Can be either bullish or bearish.

The third candle is the confirmation that the reversal is happening. My suggestion is to open a position in the fourth candle.

I've said to you, there are a lot of treasure locations which can be obtained. There are still a lot of the locations of the treasure that I haven’t shared with you yet. So keep stay tune guys .... Have you read about forex quote ? I hope you did...

Kamis, 26 Januari 2012

Candlestick Pattern

So far we have learned about Forex such as read forex quotes, etc. The next treasure map can be found in candlestick pattern itself. Yes, the candlestick will gives us a sign to dig up a treasure trove. Do not believe? Take a look at the patterns that occur in the candlestick.

BASIC CANDLESTICK PATTERNS

Candlestick Pattern
Spinning Tops Having a small body. Means to have a small movement from open to close. The shadow of the candlestick indicates a fight between seller and buyer, but no one wins.

If spinning tops occur after a long trend, usually there will be a reversal. Because the buyer or seller is not much left.


Candlestick Pattern
Marubozu show that the buyer or the seller holds full power. There is no shadow of marubozu. Open price same as high prices. And close prices same as low prices.


Candlestick Pattern
Doji has the same price between the open and close, or their bodies are very small. Indicate doubt or struggle for position between the buyer and seller.

To use it, you should see the previous candle. If a doji visible after a long hollow bodies, such marubozu, that means the buyer or seller has lost strength and weakened.


SINGLE CANDLESTICK PATTERNS

Candlestick Pattern
Hammer is very useful to find the location of a bullish reversal after a downtrend. As prices fall, the signal of hammer, a near below the prices will start rising again. The length of the lower shadow indicates that sellers pushed prices lower, but buyers are able to overcome selling pressure and closed near the open price.

But you still have to use a laser beam from your eye. Do not rush to open a buy position because you see the hammer. As a precaution, need further identification such as the presence of a bullish candlestick after the hammer. Hammer Candlestick color does not matter.

Hanging Man is also very useful for finding the location of a bearish reversal after an uptrend. long lower shadow shows that sellers pushed prices lower during the session. Buyers are able to push prices back some but only near the open price. This tells us that there are no buyers are left to gives the momentum needed to raise prices. Hanging Man Candlestick color does not matter.

Inverted Hammer and Shooting Star also look the same. The only difference between them is whether you are in a tendency to trend down or up. Both candles have tiny little bodies (filled or empty), over a long shadow, and shadow under the smaller or nonexistent..

see, there are locations where the treasure was hidden.

Rabu, 25 Januari 2012

Overbought and Oversold

Now we get to the point of technical analysis, a term named as Overbought and Oversold. Overbought and Oversold is the state price that can no longer continue the trend because it was too expensive or too cheap. These are different with the support and resistance which is a psychological level which basically is just an unofficial agreement among fellow traders, overbought and oversold is a common condition and a real happening in the market.

For example, an uptrend ongoing, then in this situation, the currency becomes more expensive. If you look at a chart of EUR / USD is rising up, it means the value of EUR is increasingly expensive compared to the USD. Traders continue to hunt EUR in the hope prices will continue to rise. This is called follow the trend.

But you should know, there will be a point buyers could not buy the EUR because the price was too expensive. Usually their capital is no longer sufficient to buy EUR in a certain amount. This condition is called overbought.

And when a downtrend ongoing, there will be a point in stopping the price down because the price was too low so that the seller is no longer possible to sell the currency. This is called Oversold.

Overbought and Oversold can be a treasure trove for you. In an overbought and oversold it is expected that the trend will soon stop and reverse direction. The key to his treasure is, buy when oversold and sell when oversold. Again, this is can avoiding the risk of forex

Overbought and Oversold also often occur at points of support and resistance because both of them are the same point, namely the trend counter. But not always so.

Back to overbought and oversold, we've found the key to unlock the treasure chest. But we still do not know the location of the treasure. What we need is the Mr.map. "Mr.map, come on out, we need your help."

A map in this case is the indicator type oscillator such as RSI or Stochastic. These indicators are designed to determine overbought and oversold points. This time I want to use the stochastic oscillator.

Overbought and Oversold

Let's see, our Mr.Map gives a lot of places where the treasure is located. Okay, I'll be a rich guy as soon as possible. hohoho,, do not rush .. still many lessons to be learned. keep use the demo account. Happy treasure hunting.